

Pharmaceutical manufacturing backgrounds and distribution can be very fast-paced, thus data-driven decision-making can make all the difference. Pharma KPI dashboards show a real-time view of key metrics, enabling pharma executives to optimize operations, reduce costs, and improve patient outcomes.
KPI Dashboards of Pharma: Are They Make a Change?
Pharma KPI dashboards are actionable tools that drive operational excellence and strategic decision-making. They offer real-time insights into critical areas like manufacturing performance, quality management, inventory management, and supply chain efficiency. Utilizing data-powered solutions, pharma companies can automate knowledge generation to trap actionable insights to help pharma executives detect opportunities for process enhancements, cost savings, and product quality improvements.
Well-designed KPI dashboards allow pharma players to track and respond to trends, identify and address issues before they become problems, and make sure they are meeting regulatory obligations. They enable alignment and collaboration across functions around common objectives. Pharmaceutical KPIs dashboards ensure the availability of medications that are safe, effective, and of high quality, which ultimately leads to improved patient outcomes.
Loading Data in Pharma Company KPI Dashboard
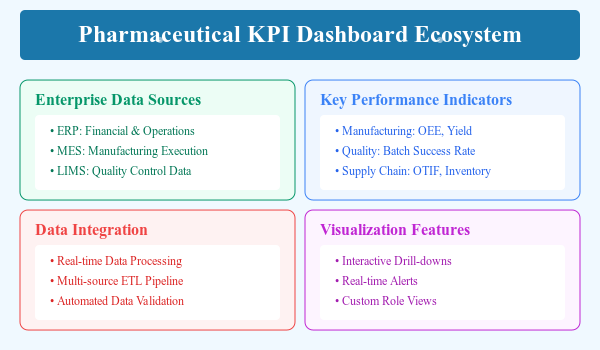
Pharmaceutical KPI dashboards combine key data from various enterprise systems:
Financial, procurement, and order management data from Enterprise Resource Planning (ERP) systems enables you to track business operations and resource allocation as a whole. Manufacturing Execution Systems (MES) provide production metrics and batch records that monitor manufacturing efficiency and compliance.
One example where this is implemented is Laboratory Information Management Systems (LIMS) supply quality control testing results and stability data; ensuring continuous monitoring of product quality metrics. Warehouse Management systems (WMS) monitor inventory levels, picking productivity and shipping performance to drive supply chain execution.
Customer Relationship Management (CRM) platforms consolidate sales data, market demand signals, and customer service metrics, allowing managers to gauge the performance of the market and the satisfaction of the customers.
ETL (extract, transform, load) processes, APIs, and data virtualization layers are all used to integrate data. The objective is to integrate data from diverse sources into a unified store or data warehouse, driving analysis and reporting. It is important that these should undergo thorough validation as KPIs will be dependent on quality, consistent, and timely data, ensuring the accuracy and reliability of the downstream KPI Dashboard.
Don't Fear Having Too Much Data
Big data and better analytics pave the way for pharma companies to utilize millions of data points for better decisions. Normally it would seem a daunting task, but new-age business intelligence tools & data viz platforms are apparently built to ingest massive amounts of rich data.
The challenge is curating a proper set of KPIs that supports the company's strategic priorities and organizational goals. Pharma companies never fell to their knees as they learned to respect data and build data governance processes for data quality, data security, and data privacy– not reduce the data attributes they capture. This may include the use of data validation checks, data lineage tracking, access controls, and others.
Pharma companies can analyze various stages of drug development and patient trials for more advanced inferences, information triangulation, and predictive insights. Techniques from advanced analytics machine learning to artificial intelligence can find correlations, predict trends, and optimize processes in ways that were not possible when data was limited.
Finding Respective Pharma Company KPIs
Important Manufacturing KPPP + OEE, Capacity Utilization, Yield & Throughput, Changeover Time, Scrap/rework For a more complete view of production efficiency, these are metrics that need to be monitored.
The Quality KPIs include batch failure rate, Out-of-specification (OOS) percentage, complaint rate, recall rate, and CAPA cycle time to ensure compliance with product quality.
Supply chain KPIs track inventory turnover, stock-out rate, On-Time In-Full (OTIF) delivery metrics, and supplier performance while also measuring days of inventory on hand for optimal supply chain management.
Financial KPIs track gauges of gross margin, ratio of operating expenses, cash-to-cash cycle step, Return on Invested Capital (ROIC), and NPV of R&D portfolio.
KPI Dashboards for Pharma Companies
Case Study 1: AstraZeneca Manufacturing Analytics
AstraZeneca's global manufacturing analytics platform on 30+ sites delivered 18% OEE improvement, 25% unplanned downtime reduction, 12% yield improvement, 20% quality defects reduction, €250M cost savings with integrated monitoring of MES, LIMS, and ERP.
Case Study 2: Pfizer Quality Control Dashboard
Data real-time quality monitoring system to get 23% fewer batches failed, 45% faster deviation detective & €15M annual savings in advantages by integrating LIMS, MES & quality management.
Learning from others: A Novartis supply chain case study
→ 30% improvement in Forecast accuracy
→ Reduction of $350M in Inventory
→ Achieving OTIF delivery to 98%
→ 20% Gains in Logistics efficiency
... all these impressive KPIs on Novartis helped them consolidate their supply chain data on a single dashboard.
Data Sources Integration & Visualization
Modern integration tools allow for real-time data ingestion from ERP, MES, LIMS, WMS, TMS, and CRM systems. These aspects include data quality assurance, governance standards, security protocols, and scalability requirements.
Visualization Tools – These tools offer a customized dashboard with drill-down functionality, real-time alerts, predictive analytics, and collaboration features. The best practices also emphasized creating role-specific visualizations, balanced levels of details, complete but selective data, and clean visual design principles.
Tips for Visual Data Representation
Dynamic data scripts are essential for translating complex pharma KPI data into actionable insights—an ideal platform for potential customers to explore and discover. Choose the right chart type based on the data and key message. Line charts are best for displaying trends over time, and bar charts also allow for comparisons at a glance. Pie charts are good for showing relative share and scatter plots can show a relationship. On the other hand for process data, control charts to detect common vs special cause variation.
It should be clean and minimalistic with a visual hierarchy directing the user's attention to the most important dashboard elements. This provides a better overview of the relationships in the data. Use colors strategically to emphasize important information, while being considerate about how people with visual impairments perceive their designs.
Another element of efficient dashboards relies upon interactivity. Users need to be able to drill down, filter, and get more details on mouse hover. You should also ensure the dashboard is responsive and works well on different screen sizes and devices. Lastly, the added context to help with interpretation, such as a benchmark industry average, or target.
Interpretation of Pharma Company KPI Dashboard Best Practices
While it is important to design KPI dashboards well, it is equally important to interpret them correctly. A solid cadence for reviewing dashboards, be it daily (for operational KPIs) or monthly (for strategic) drives action on the data collected. Hold these reviews with cross-functional stakeholders who can lend diverse perspectives and subject matter expertise.
In looking at dashboards, you want to see trends and correlations and not just dots of data. Investigate anomalies and outliers in order to understand root causes and to ensure proper corrective action is taken. Do keep in mind things outside the company like market dynamics, regulatory changes, or supplier issues can affect these too.
Interpreting any dashboard effectively necessitates a balance of high-level strategic thinking and low-level tactical problem-solving. The data should drive everything from long-term planning to daily decision-making. The team should also have an explicit process to translate insights into actions and assign owners and due dates, which helps ensure continuous improvement.
Insights from Dashboards that You Can Act On
Pharma KPI dashboards are capable of driving real-world value with rich data from the value chain. This enables better prioritization of (continuous or large scale) improvement efforts through the analysis of OEE data, identifying bottlenecks and opportunities. Good data can help identify root causes for defects and enable you to focus on CAPA activities. Using predictive maintenance analytics can prevent unplanned downtime and increase asset life.
In the supply chain, inventory and demand data help improve forecasting accuracy, reducing excess inventory but also avoiding stockouts. Performance metrics of suppliers can be influenced by effective Supplier Relationship Management which leads to smarter strategic sourcing, aided by negotiation tactics. Logistics data can aid with network design, carrier selection, and route planning.
Sales and customer data can be used by commercial teams to find opportunities for growth, tailor marketing strategies, and enhance customer service. Financial metrics will help inform pricing, R&D investments, and M&A strategies. The important part is having processes for reviewing the data, extracting insights, and taking actions regularly.
KPIs Dashboard: Say Bye Bye To Common Challenges
Overcoming Challenges in Creating Pharma KPI Dashboards
Some of the common traps that people fall into are trying to measure too much leading to data overload and lack of focus. Start with a smaller, core set of KPIs that relate to the strategic objectives and expand gradually. Every KPI should have a well-defined goal or intention, a responsible owner, and a plan of action.
Another common challenge is data quality. Now, Dashboards are as good as the said data behind. From point of entry through to reporting, it is critical to implement rigorous data validation processes. The latter involves aspects like the completeness, correctness, uniformity, and value of the data. Inconsistent data affects trust in insights and one of the ways to keep them in check is by auditing data sources regularly in addition to cleaning the data.
The third challenge is inducing adoption and action. A data-driven culture does not happen overnight, and it will involve leadership buy-in, change management, and upskilling. Actively involving end-users in the dashboard design process, offering regular training and support, and celebrating successes in usage across the organization contribute to driving adoption. Equally as critical is having clear processes for translating insights into action, as well as feedback loops that track the impact.
Finally, dashboards need continuous improvement to stay relevant. KPIs and dashboard designs need to change as business priorities change. Frequent methods of gathering user input, tracking usage analytics, and doing periodic assessments help keep dashboards impactful. Adopting an agile, iterative process for dashboarding provides for fast time-to-value and constant improvement.
There you have it: details for streamlining with Pharma Company KPI dashboards!
Data and Knowledge Analytics
KPI Dashboards: Driving Operational Excellence in Pharma
They offer real-time visibility into key processes, allowing data-driven optimization across the value chain.
One of the key aspects of effective dashboards is the integration of data from multiple sources, turned into actionable insights through intuitive visualizations. To maximize impact, pharma companies must implement best practices in dashboard design, data governance and user adoption.
The advantages can be substantial: increased manufacturing productivity, reduced stockpiling, improved regulatory compliance, and better-informed business development choices. The KPI dashboards certainly will have a higher role as this industry gets more complex and digitized.
With the right dashboards to automate, monitor, and visualize, pharma companies can not only maintain operational excellence but also add value to patients and to the ecosystem as a whole in a rapidly evolving environment. Leveraging data and analytics, they can turn insights into impact and raise the bar for performance.

![Create a Telegram Bot Without Coding: A Comprehensive Guide [2025]](https://storage.googleapis.com/lazy-apps-images-bucket/blogs/bb8e7a4120d399faad30323790086f47_resting%20sloth_%2012-12-2024%20at%2022-49-33.jpeg)


